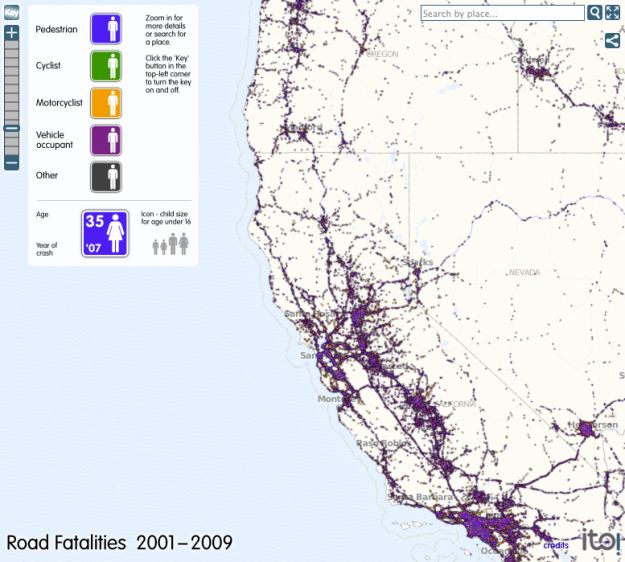
For The Guardian, ITO World maps about 370,000 road-related deaths from 2001 through 2009, according to the National Highway Traffic Safety Association. The map is kind of rough around the edges, but it gets the job done. Easily zoom in to the location of choice either by clicking buttons, or type in the area you want in the search box. Zoom in all the way, and you'll notice each accident is represented by an icon indicating type of accident, the age of the person who died, and year of crash.
As you might expect, accidents are more concentrated at city centers and on highways. What I didn't expect was all the pedestrians involved.

1 Kommentare:
krass?!..
Kommentar veröffentlichen